Fintech State of the Union Infographics
Across the globe, consumers’ approach to payments is evolving. It’s no surprise that every country contains different behaviors and preferences. Sifting through information found in vast reports is a challenge that a reader may be unwilling to meet.
So, we made it easy for them. Because we know that no matter how good content is, if it’s not consumed, it’s meaningless.
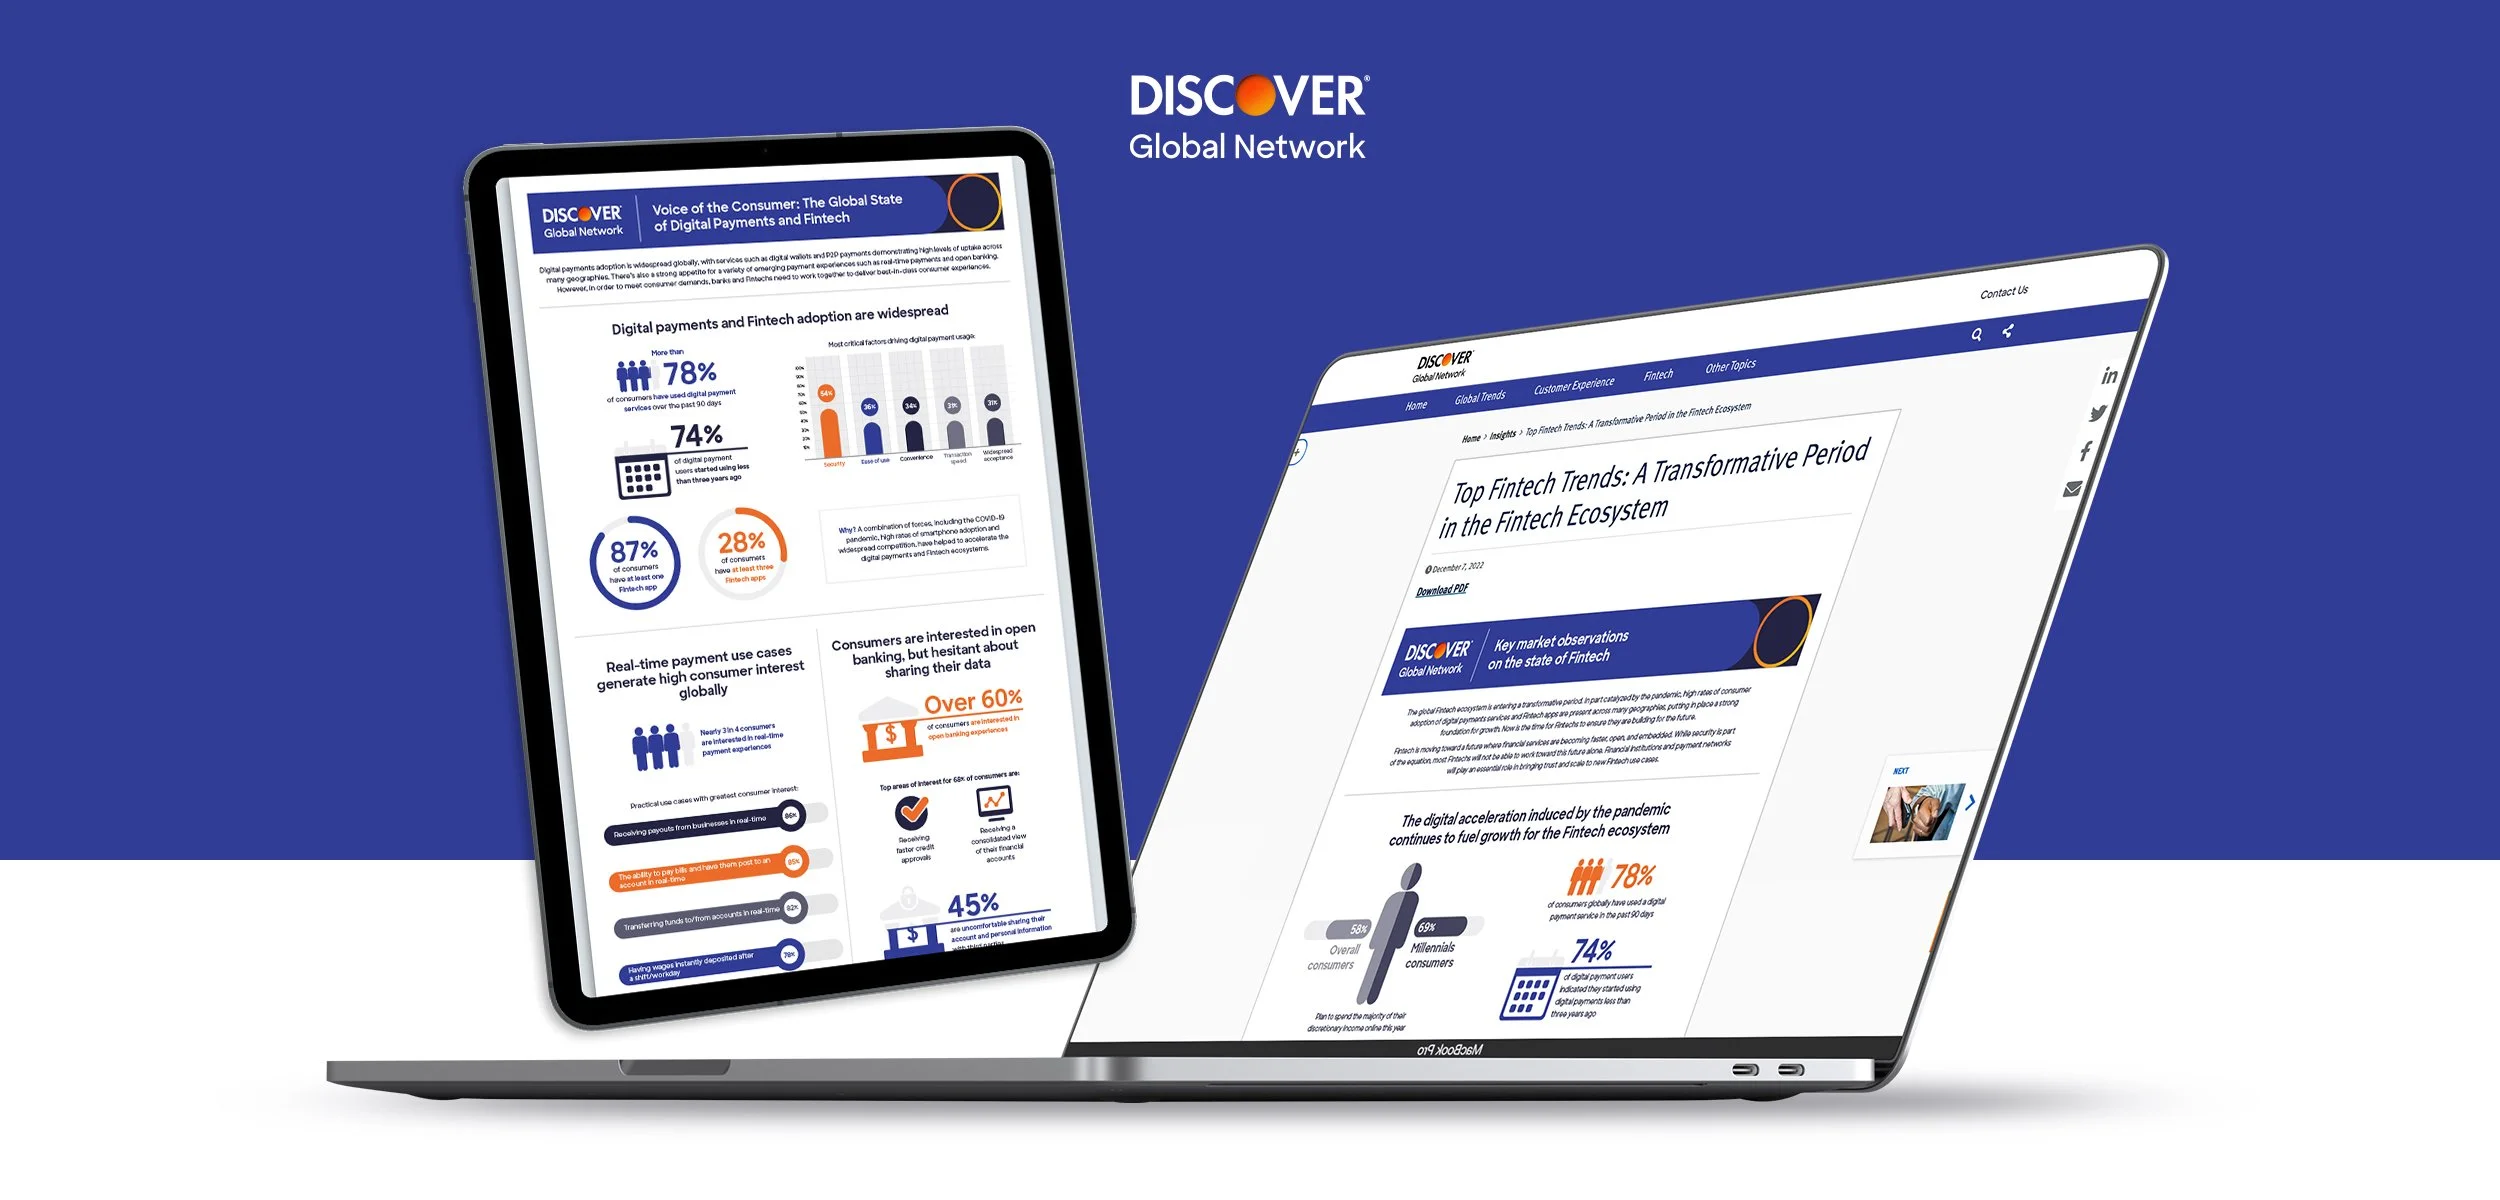
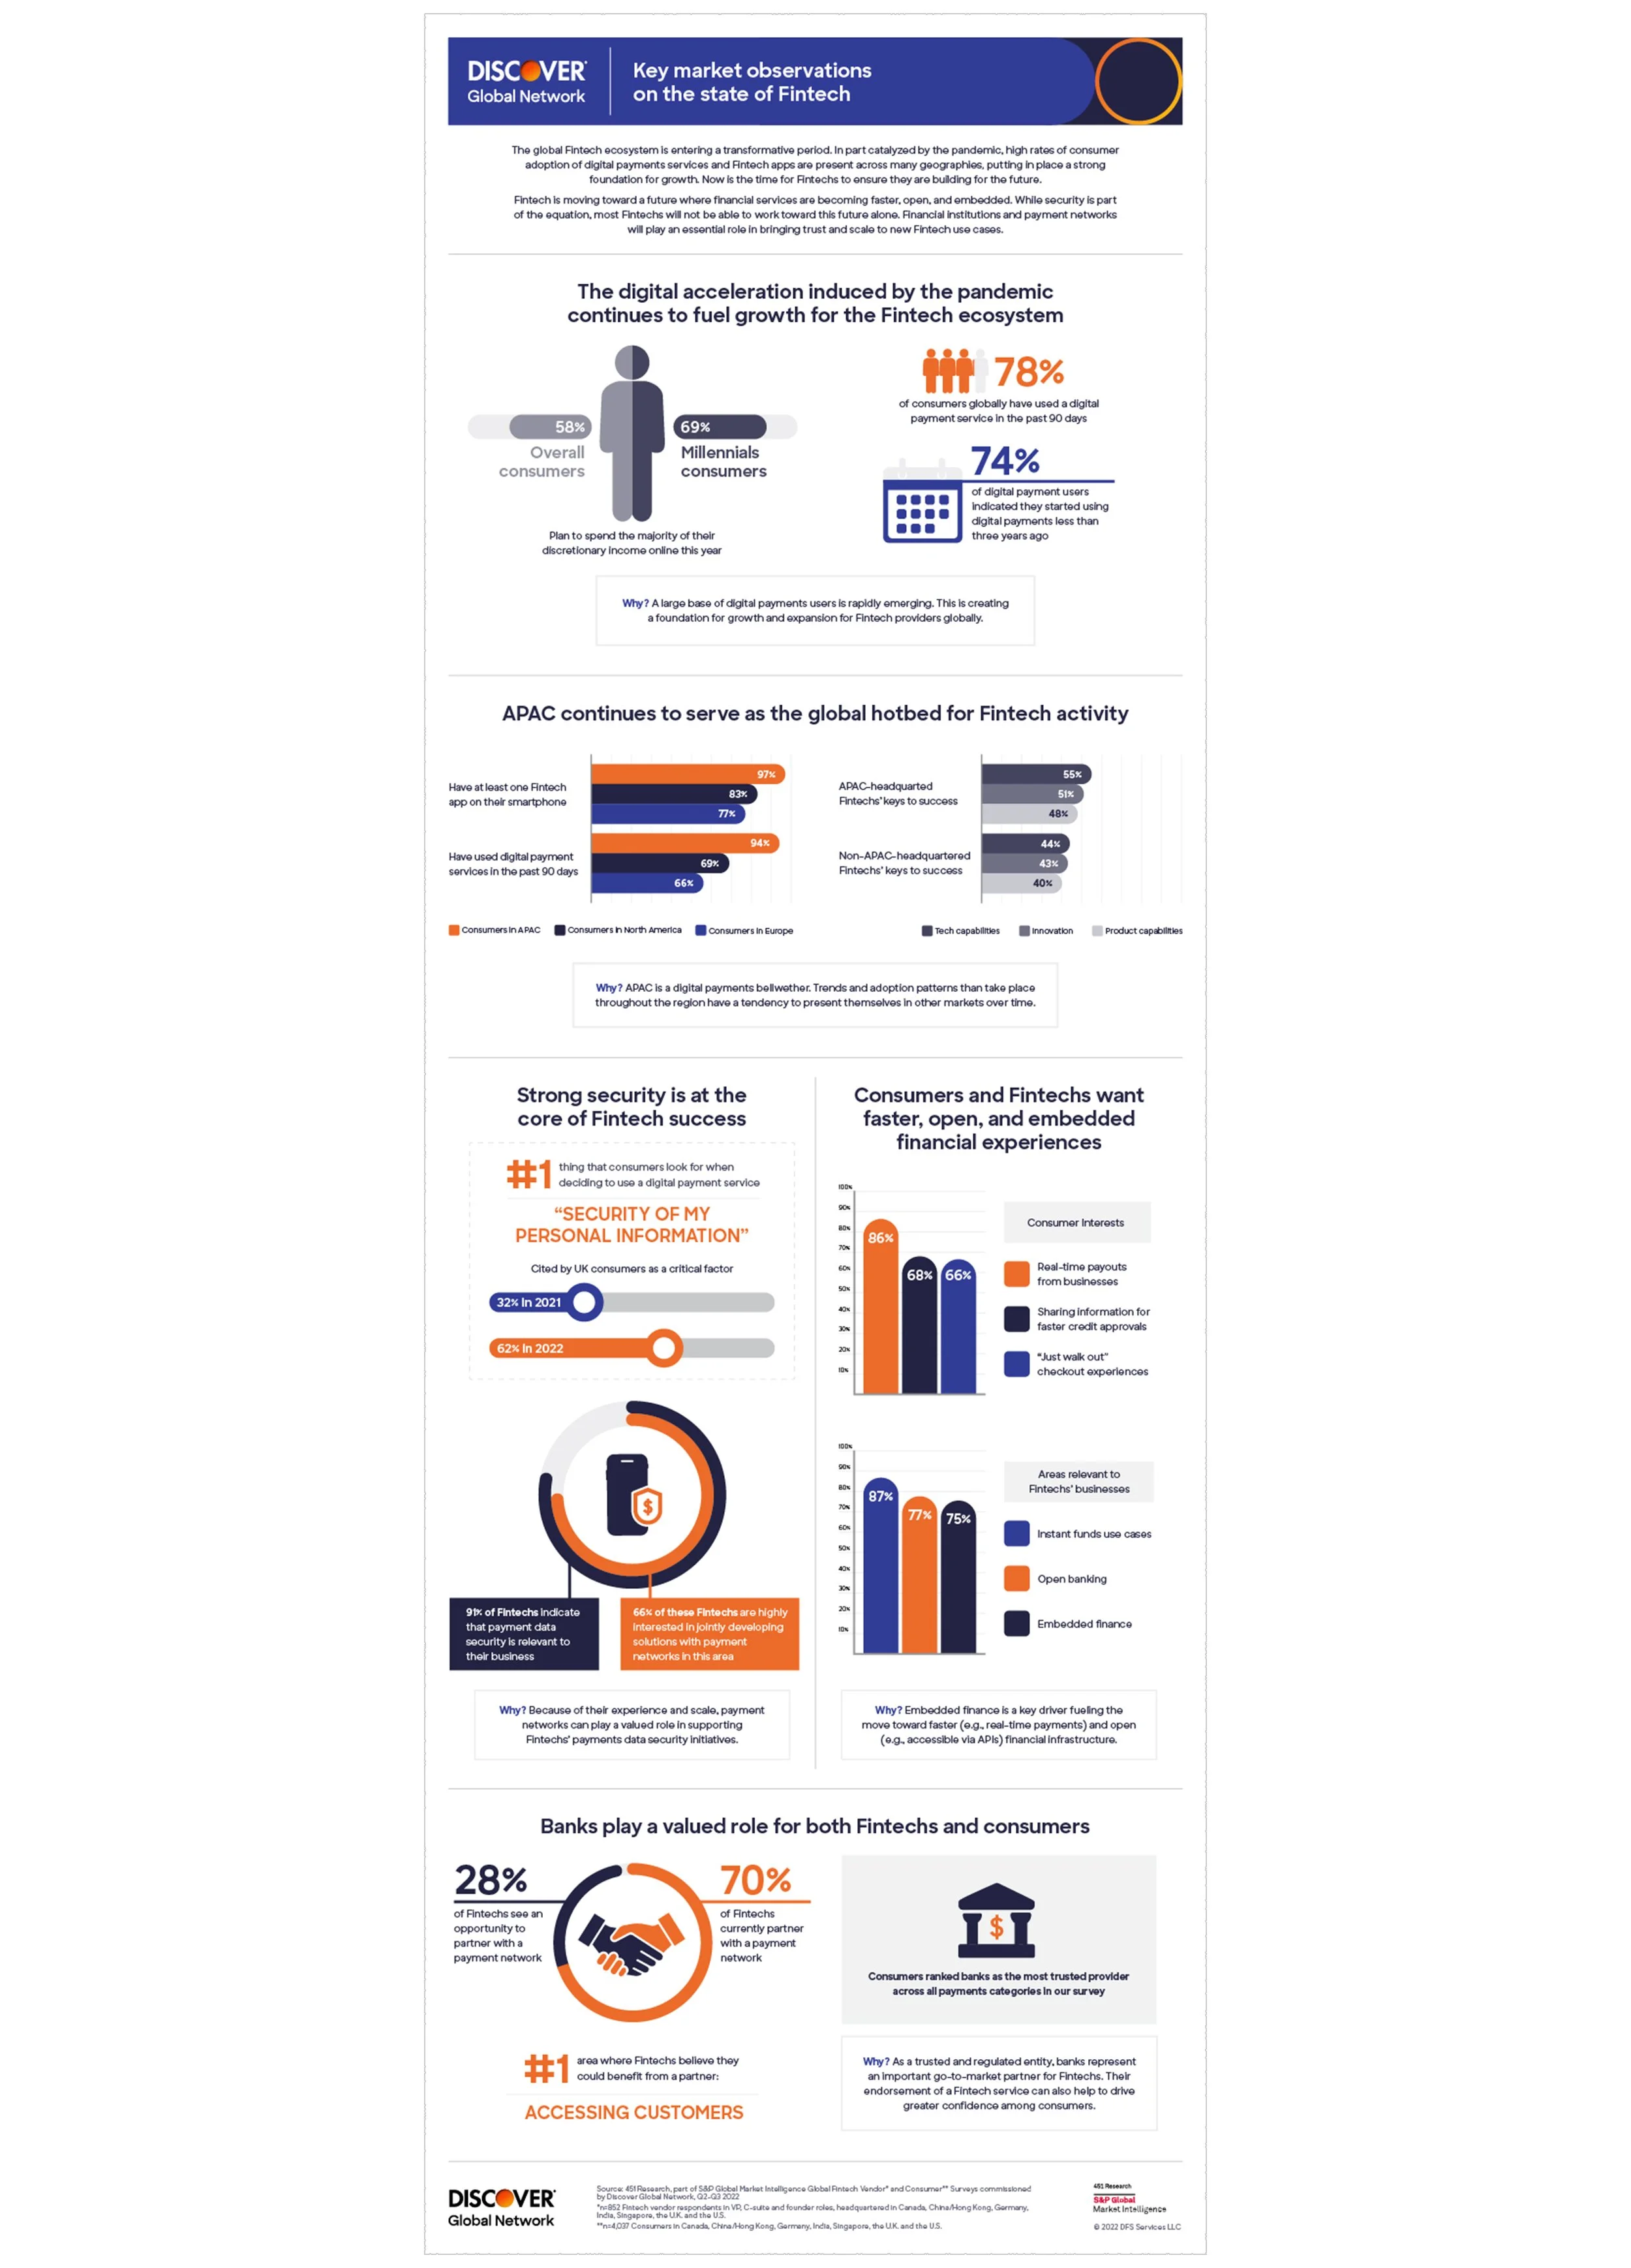
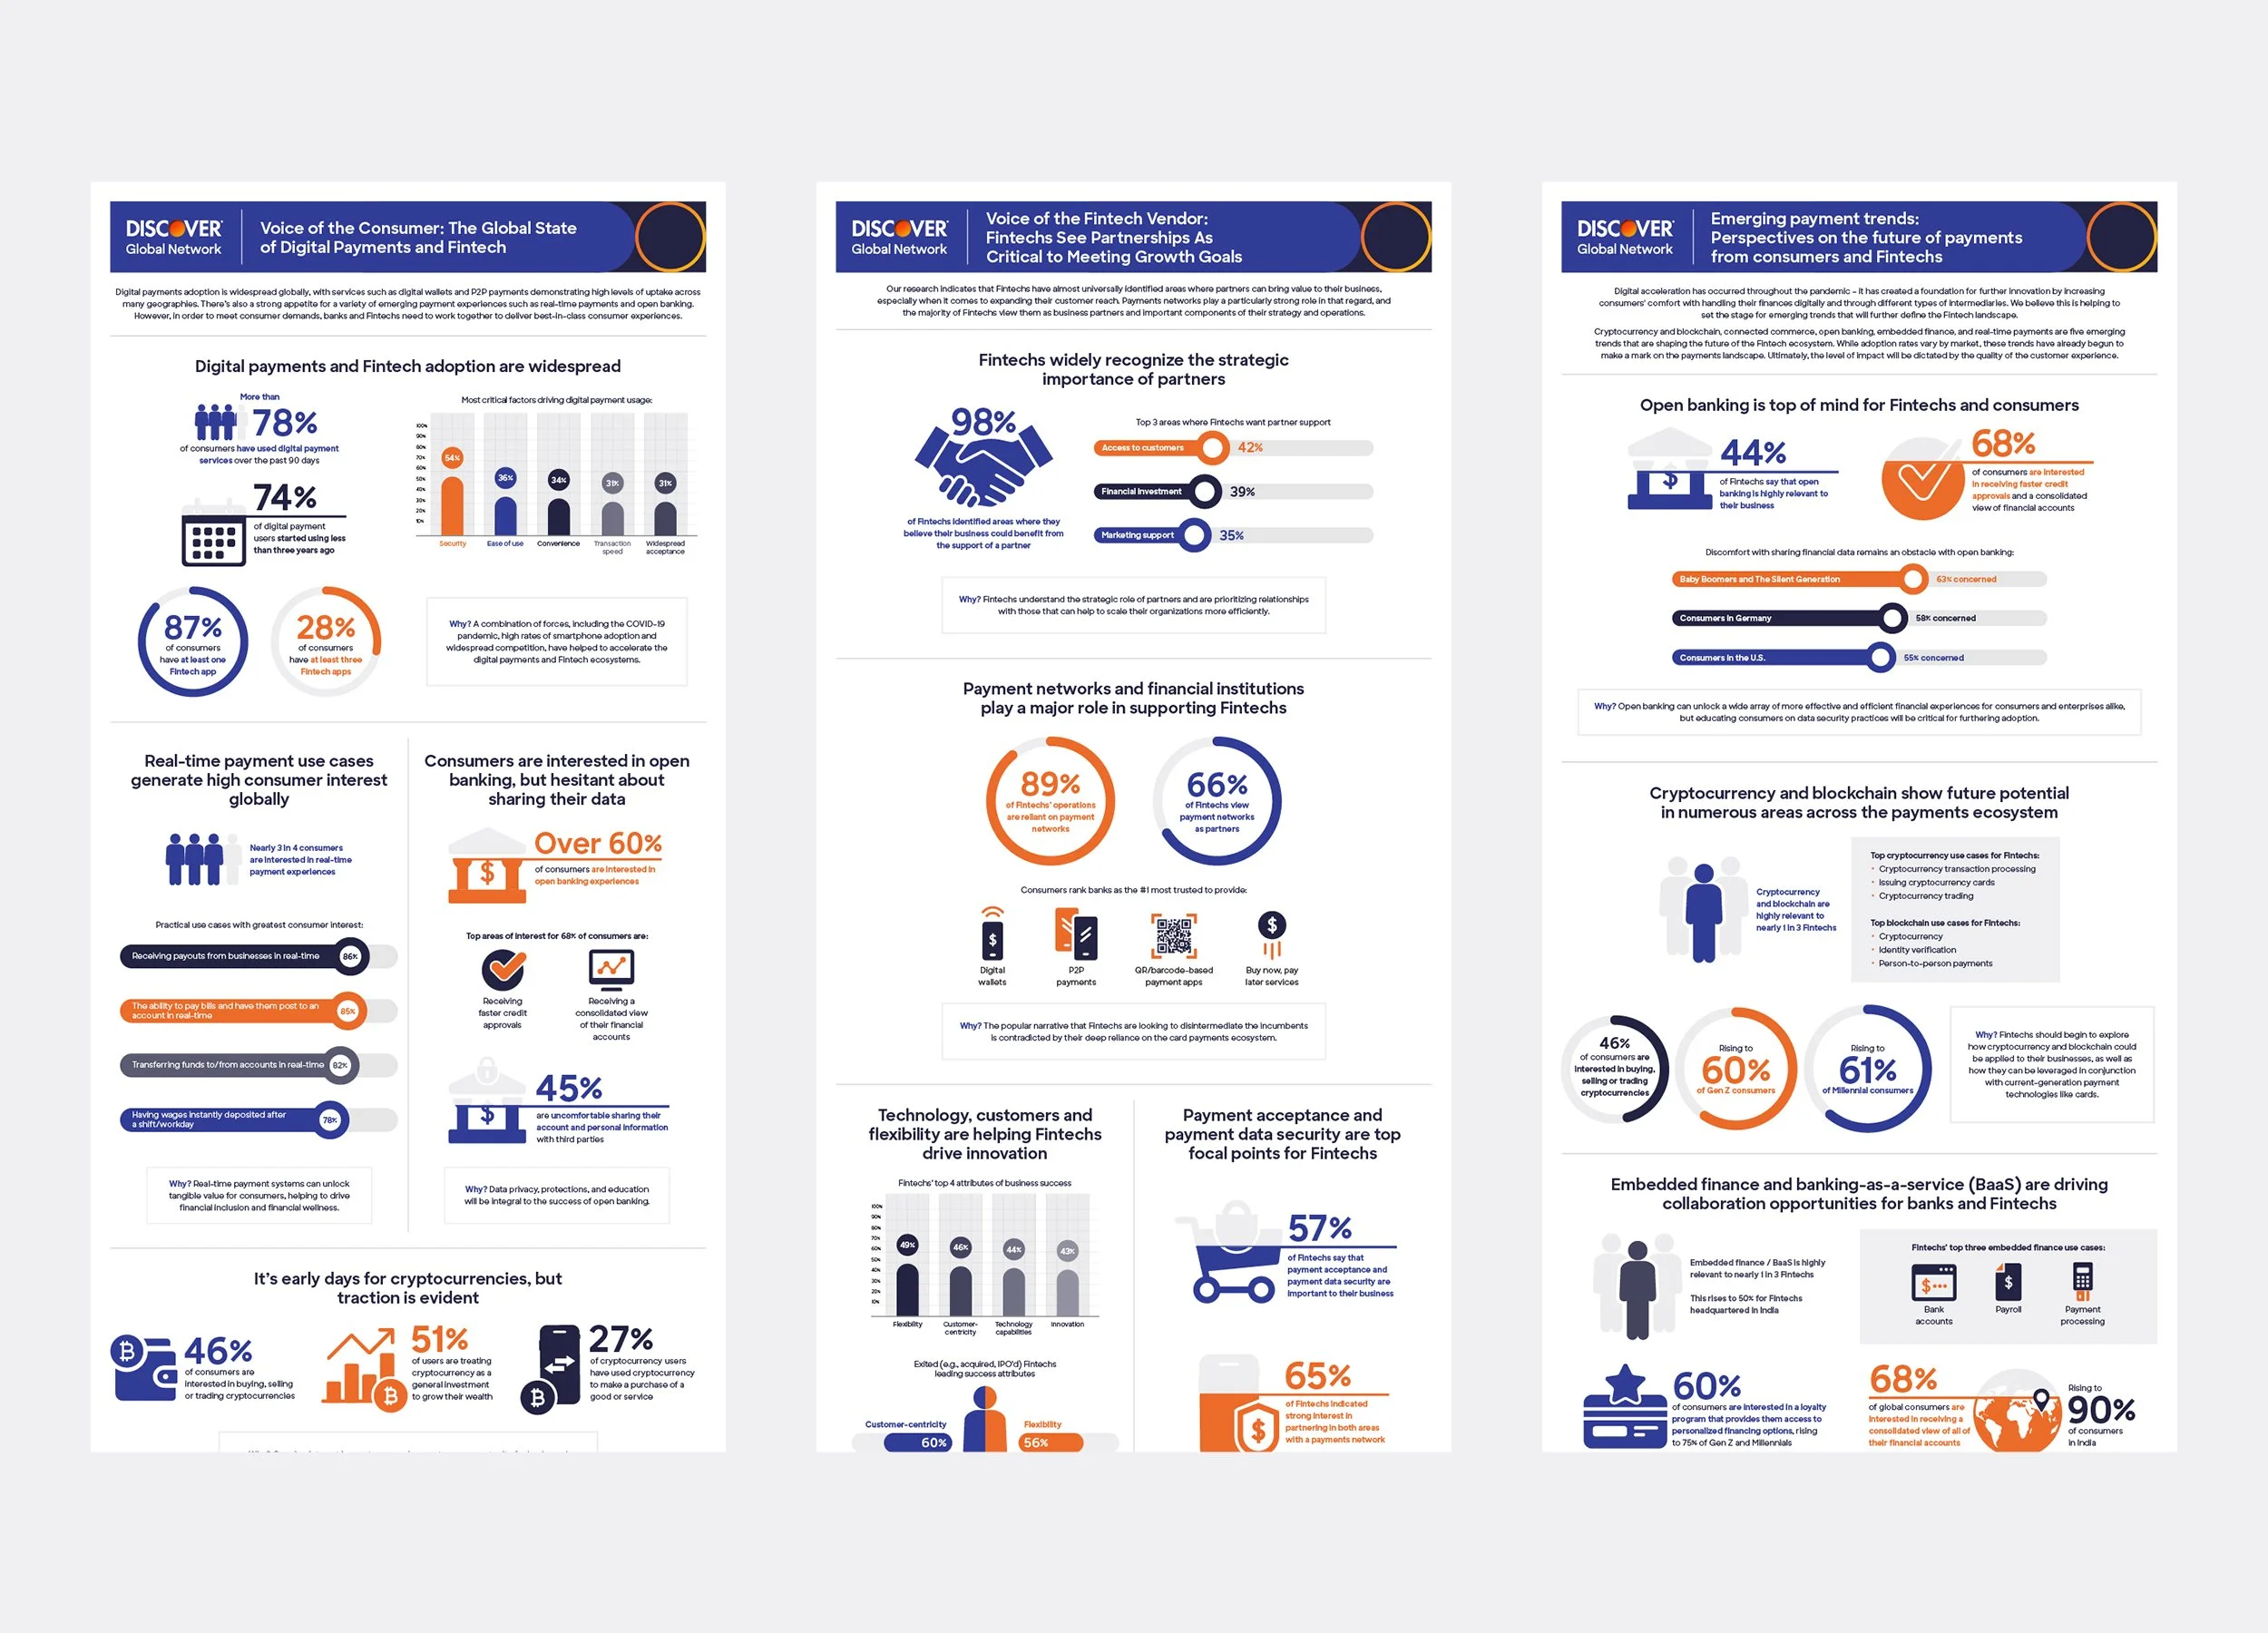
What started as a lengthy paper full of data points, summaries, and trends and predictions, was transformed into a visual story that used smartly selected graphics & icons, strategically planned sectioning of data, and the use of color to convey key information in a scannable and impactful way.


